
Bitcoin Price Analysis: Will BTC Crash Below $70K Next as Selling Pressure Intensifies?
Artículo sindicado de CryptoPotato. · Artículo original ↗
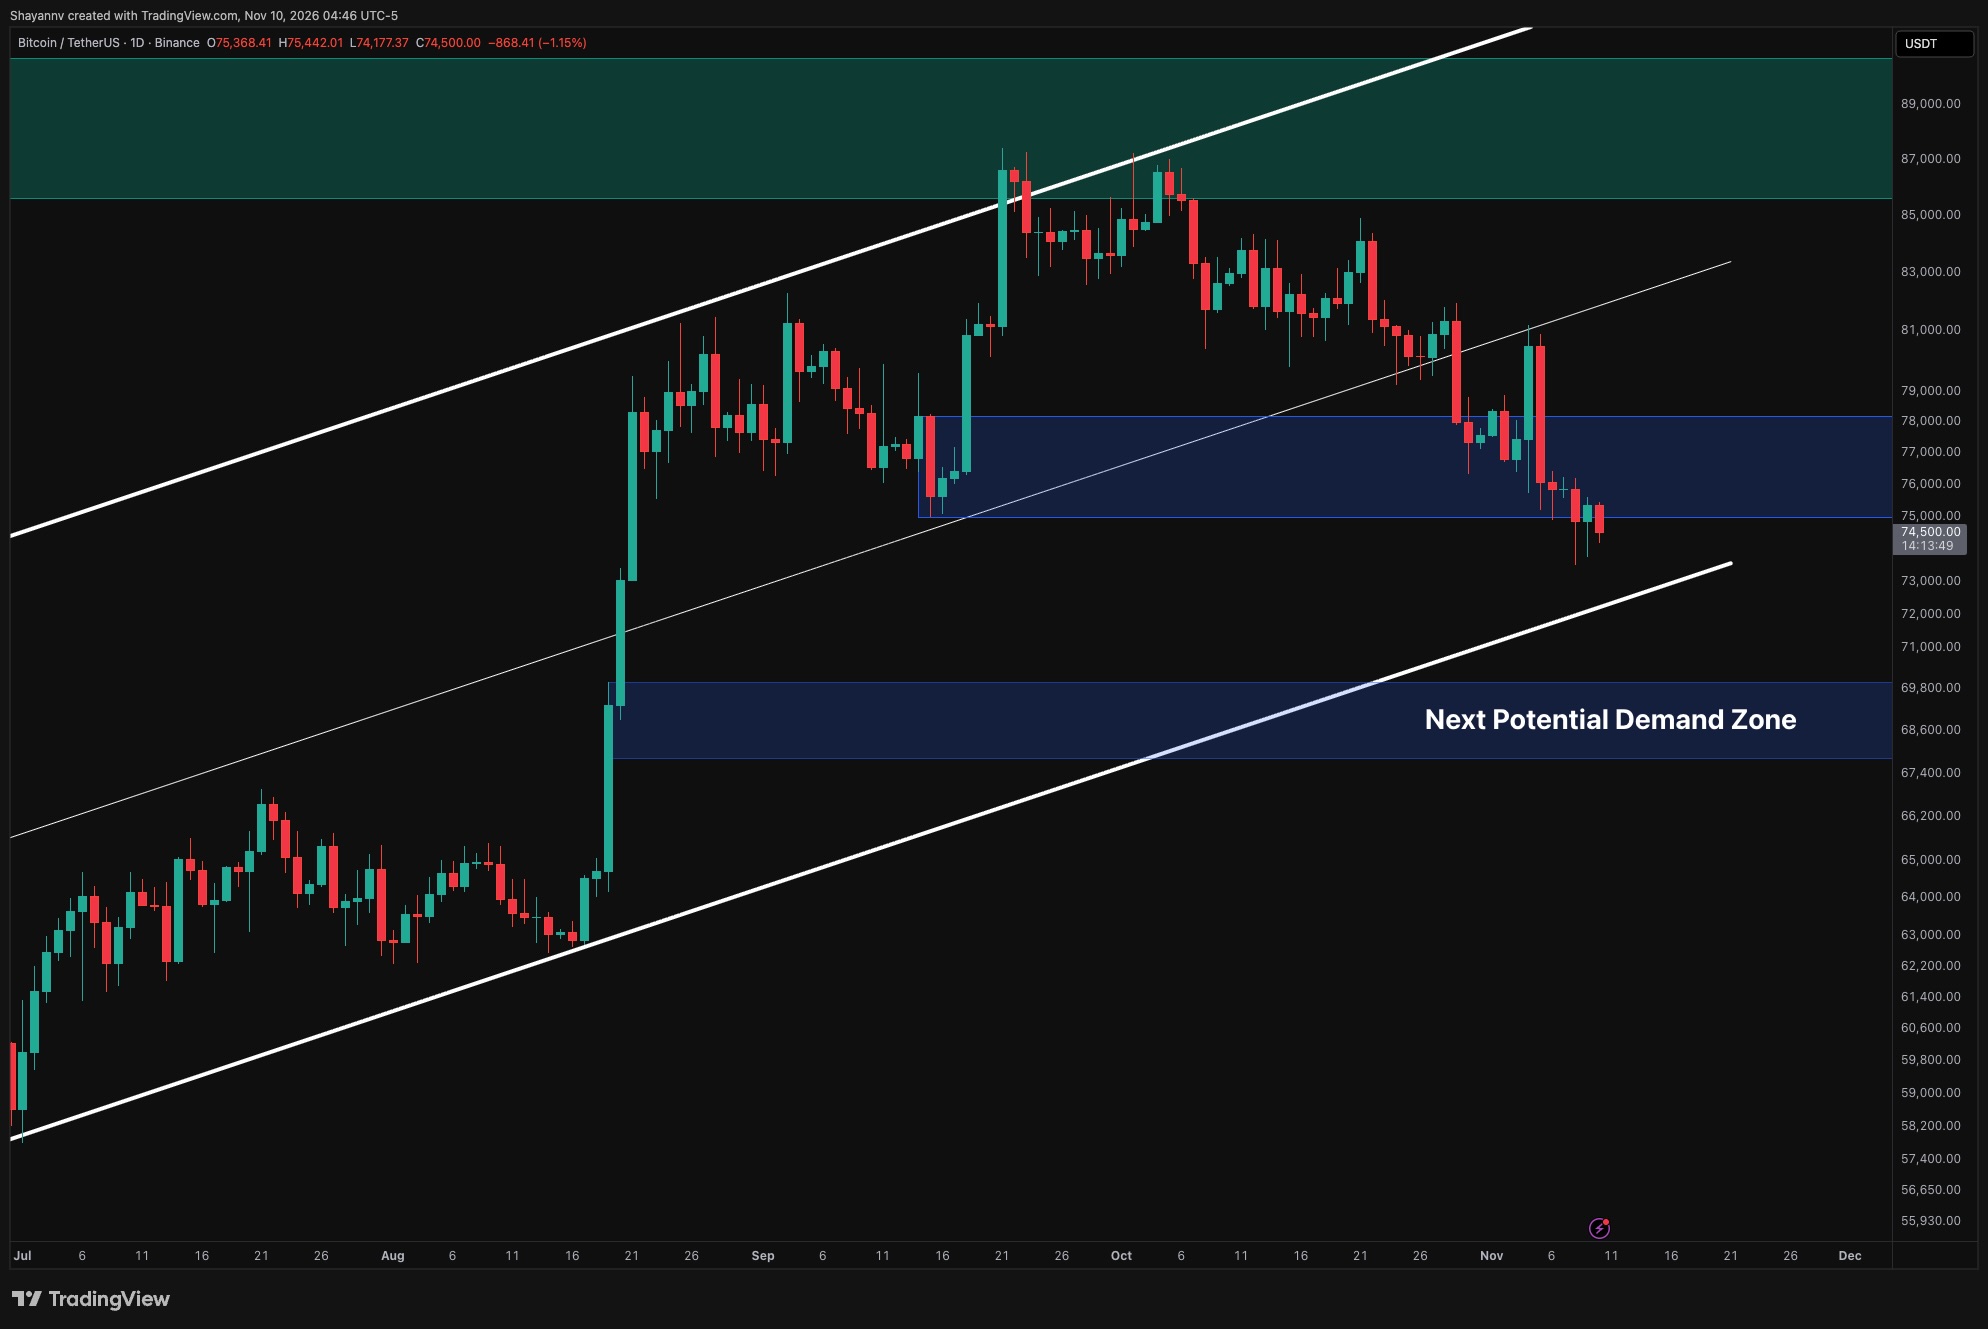
Bitcoin has slipped beneath the $74K support area, leaving buyers struggling to regain control near $74.5K. The latest breakdown increases the risk of a deeper correction, while the liquidation heatmap highlights nearby concentrations on both sides of the market.
Bitcoin Price Analysis: The Daily Chart
The daily chart shows Bitcoin trading below the lower boundary of the $75K–$78K demand zone following repeated tests. The earlier recovery toward $81K was rejected near the ascending channel’s midpoint, and subsequent rebounds have failed to reverse the sequence of lower highs and lower lows.
Although recent candles show buying interest beneath $74K, the response has been insufficient to reclaim the broken demand zone sustainably. The current daily candle remains open, so confirmation depends on whether Bitcoin closes below $75K or recovers that level before the session ends.
Continued acceptance beneath $75K would leave the ascending channel’s lower boundary, around $73K, as the next important technical reference. A decisive break below that trendline would weaken the broader rising structure and expose the marked $67.8K–$69.8K demand zone, which encompasses part of August’s strong upward expansion.
Alternatively, reclaiming $75K would reduce immediate downside pressure, but buyers would still need to recover $78K to demonstrate a more meaningful improvement.
Until then, rebounds remain vulnerable to selling within the former demand area.
BTC/USDT 4-Hour Chart
The four-hour chart shows Bitcoin breaking beneath both its descending channel’s lower boundary and the recent consolidation base. The marked decision zone around $75.5K–$77K now sits overhead, making it an important test for any recovery.
The initial selloff reached approximately $73.5K before buyers pushed the price back toward $75.5K. However, that bounce failed near the lower edge of the decision zone, and BTC has since returned toward $74.5K. This rejection suggests that former support is beginning to act as resistance.
As long as Bitcoin remains below $75.5K–$77K, another test of the $73.5K low remains plausible. Losing that low would reinforce the bearish continuation scenario and bring the daily channel support around $73K into focus.
La noticia completa la publica el medio original. Aquí mostramos todo lo que hemos podido sincronizar.
Abrir original ↗